A first estimation of the impact of public health actions against COVID-19 in Veneto (Italy)
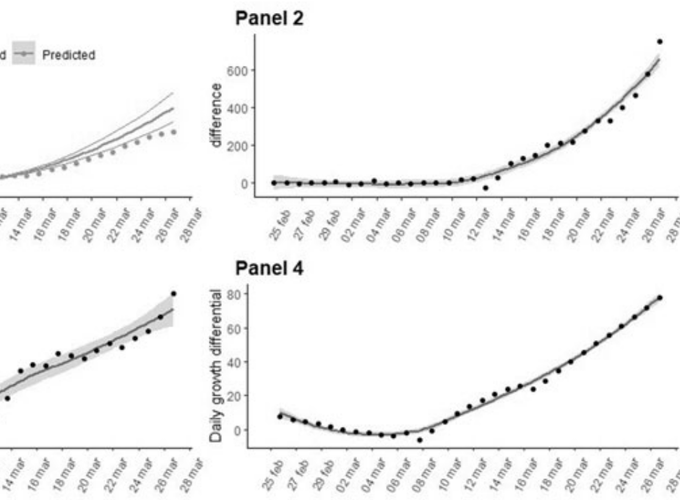 Panel 1 Time series for the indicators related to the COVID-19 epidemic outbreak in Italy reported and estimated from 24 February to 27 March. Panel 2 The number of avoided COVID-19 hospitalised cases in the Veneto region compared with the trend expected as of 12 March. Panel 3 Days of delay estimated by taking the difference between the days needed to achieve an equal level of hospitalisations between the estimated total hospitalisations and the observed data. Panel 4 The difference in daily growth (number of daily hospitalisations) between the estimated and observed epidemic curves.
A first estimation of the impact of public health actions against COVID-19 in Veneto (Italy)
Abstract
Background Veneto is one of the first Italian regions where the COVID-19 outbreak started spreading. Containment measures were approved soon thereafter. The present study aims at providing a first look at the impact of the containment measures on the outbreak progression in the Veneto region, Italy. Methods A Bayesian changepoint analysis was used to identify the changing speed of the epidemic curve. Then, a piecewise polynomial model was considered to fit the data in the first period before the detected changepoint. In this time interval, that is, the weeks from 27 February to 12 March, a quadratic growth was identified by a generalised additive model (GAM). Finally, the model was used to generate the projection of the expected number of hospitalisations at 2 weeks based on the epidemic speed before the changepoint. Such estimates were then compared with the actual outbreak behaviour. Results The comparison between the observed and predicted hospitalisation curves highlights a slowdown on the total COVID-19 hospitalisations after the onset of containment measures. The estimated daily slowdown effect of the epidemic growth is estimated as 78 hospitalisations per day as of 27 March (95% CI 75 to 81). Conclusions The containment strategies seem to have positively impacted the progression of the COVID-19 epidemic outbreak in Veneto.